The Impact of Singapore Math at MPA

[Note: I’ve enjoyed working with Mounds Park Academy (MPA) in Saint Paul, Minnesota, since 2014. For the last three years, MPA has generously hosted our annual Jumpstart Your Singapore Math Instruction workshops.]
Renee Wright

I was thrilled to read a January 9, 2020, blog post, “The Impact of Singapore Math at MPA,” written by Lower School Director Renee Wright. It is a brief, but thorough, overview that anyone considering a Singapore program should read.

Renee recounts some of the many reasons the school chose to adopt a Singapore program in kindergarten through fifth grade six years ago, including:

Singapore Math meets the needs of all learners, provides extra practice and support for students when necessary, and is inherently challenging for the advanced math student.

To illustrate her point, Renee invites readers to consider a word problem assigned to fourth graders:

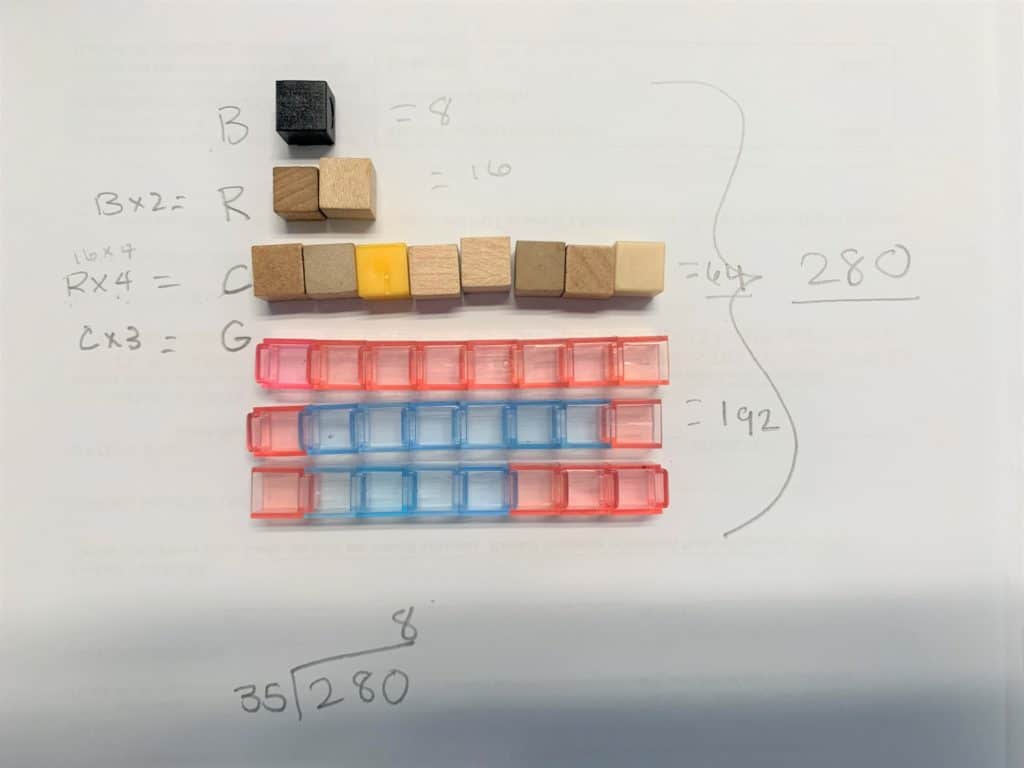
Mrs. Wright, Dr. Hudson, and Ms. Tesdahl all wrapped lots of presents over the holidays. Mrs. Wright wrapped four times as many as Dr. Hudson (remember, she has grandchildren!), and Ms. Tesdahl wrapped 3 more than half as many as Mrs. Wright. Together they wrapped 31 presents. How many presents did Dr. Hudson wrap?

She notes that this is a challenging problem for Lower School students and maybe even readers. But:

Believe it or not, fourth-graders at Mounds Park Academy approached this problem with confidence and were successful in finding the solution.

Renee includes data to document student success:

We can carefully examine the longitudinal data and impact of Singapore Math. One way is to review ACT Aspire assessment data collected over the past several years to determine if our students’ scores have shown improvement. Our student data has been compared to national percentiles and independent school benchmarks and it shows that our students have made steady gains in math concepts and usage.

She also includes anecdotal evidence from several teachers, including: Renette Stinson and Shelley Steingraeber (third grade); Deedee Stacy and Yamini Kimmerle (fourth grade); and Chris Peterson (fifth grade). Deedee and Yamini said:

Singapore Math is designed to give students an extremely well developed mathematical foundation, and to challenge them daily to apply mathematical concepts in new situations. Our students at MPA love to learn, and Singapore Math makes that happen!

And what did students say?

…third graders [said] that Singapore Math is challenging, but fun! One student identified the mental math emphasis as something that helps him use math every single day. Another student said she used to hate math but now she loves it because Singapore Math makes sense.

Finally, Renee offers her reflections:

Today, as an administrator looking at the data, hearing from the teachers, and feeling the enthusiasm for math from our students, I know that adopting Singapore Math was the right decision. It has served our students well and is aligned with the college preparatory nature and foundational mission of our school. I am so proud of the time, attention, and effort our teachers have put into teaching the Singapore curriculum. I acknowledge and celebrate the math success our students have had daily in the classroom due to the Singapore Math curriculum and feel confident they are ready for their future journey of higher level math.

Share:

What’s the Word Problem?

I often work with international Schools where the teachers commit to two-three years and then move on to other schools and other countries. I was surprised by an email this week from a former 3rd-grade teacher I worked with at a school in China. She is now teaching in Malaysia.

Hi Cassy, I’ve moved on…but all that bar model training is serving me well at the math PD at my new school!

She included this image:

  • Can you write a word problem for this bar model and the calculations?
  • What grade level might this be from?
  • What do you notice about the manipuative used?
  • What questions can we ask based on the model given?
Share:

Graphing the Holidays

Originally posted 11/27/2018

Teaching between Thanksgiving and the winter break can be a challenge. How do you keep your students engaged in meaningful math learning while embracing the season? Introducing graphing and data analysis might just be the answer.

Imagine starting your day in first grade with a question about favorite holiday treats. Students can answer the question and instantly you have meaningful data that can be organized into a tally chart, picture graph, or bar graph for students to analyze. Or, students can build a bar graph with post-it notes as they make their choices. Then, spend some time analyzing the results.

Ask 5th graders if they traveled over Thanksgiving break. If so, how far? Now use this data to find mean, median, and mode, or to create a histogram for students to analyze. Or, chart the temperatures over the course of a couple of weeks and use this data to create a line graph.

Third and fourth graders could tally the number of candles in their homes for the holidays and use this data to create a line plot. Fourth graders can use their line plots to explore finding the median.

Planning a holiday party? Survey the students on what should be served and what activities should be included. Students can present the findings in a graph and use the results to determine how much and what needs to be donated or purchased to make the party a success.

The holidays are a great time to share family traditions. Why not use that information to meet some graphing and data analysis standards?

For other ideas to keep students engaged in learning read Mental Math Breaks from December 2017.

Share:

Who’s doing the talking?

A new school year brings new commitments to improving our practice as teachers of mathematics. One tip I often share with the teachers I coach is, “Ask more and tell less.” Well, that’s easy to say, but what does that look and sound like in the classroom?

Often times, the teacher’s guides are written following a more traditional, lecture-style of teaching. They encourage the teacher to model, or work problems, while the students watch, and then the students are asked to mimic what the teacher did with a similar problem. I challenge you to flip the script and replace the word “show” with “have the students model” and replace “tell” with “ask”. When your teacher’s guide says to show the students the difference or similarities between problems or concepts replace that with, “ask the students what they notice?” It’s these little tweaks that will go a long way toward engaging your students in meaningful discourse and ultimately deepening their understanding.

A fourth-grade teacher from Aurora, Colorado shared her strategies for engaging students in math talk in her classroom.

While this appears to be written for the students to follow, it also suggests some great questions for teachers to ask to generate more discussion.

As students are working through a task ask:

  • How did you solve that?
  • How do you know that’s correct?
  • Can you solve it another way?
  • Can you build a model?
  • Can you use numbers and symbols to explain your model?
  • Is that the best (most efficient) way to solve that?
  • Is your answer reasonable?
  • Do you agree or disagree with your partner’s answer?

So, who’s doing all the talking? Give some of these questions a try and let us know how it goes.

Share:

Graphing the Holidays

Teaching between Thanksgiving and the winter break can be a challenge. How do you keep your students engaged in meaningful math learning while embracing the season? Introducing graphing and data analysis might just be the answer.

Imagine starting your day in first grade with a question about favorite holiday treats. Students can answer the question and instantly you have meaningful data that can be organized into a tally chart, picture graph, or bar graph for students to analyze. Or, students can build a bar graph with post-it notes as they make their choices. Then, spend some time analyzing the results.

Ask 5th graders if they traveled over Thanksgiving break. If so, how far? Now use this data to find mean, median, and mode, or to create a histogram for students to analyze. Or, chart the temperatures over the course of a couple of weeks and use this data to create a line graph.

Third and fourth graders could tally the number of candles in their homes for the holidays and use this data to create a line plot. Fourth graders can use their line plots to explore finding the median.

Planning a holiday party? Survey the students on what should be served and what activities should be included. Students can present the findings in a graph and use the results to determine how much and what needs to be donated or purchased to make the party a success.

The holidays are a great time to share family traditions. Why not use that information to meet some graphing and data analysis standards?

For other ideas to keep students engaged in learning read Mental Math Breaks from December 2017.

Share: