 Originally posted 11/27/2018
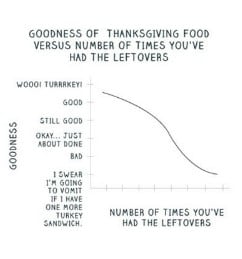
Teaching between Thanksgiving and the winter break can be a challenge. How do you keep your students engaged in meaningful math learning while embracing the season? Introducing graphing and data analysis might just be the answer.
Imagine starting your day in first grade with a question about favorite holiday treats. Students can answer the question and instantly you have meaningful data that can be organized into a tally chart, picture graph, or bar graph for students to analyze. Or, students can build a bar graph with post-it notes as they make their choices. Then, spend some time analyzing the results.
Ask 5th graders if they traveled over Thanksgiving break. If so, how far? Now use this data to find mean, median, and mode, or to create a histogram for students to analyze. Or, chart the temperatures over the course of a couple of weeks and use this data to create a line graph.
Third and fourth graders could tally the number of candles in their homes for the holidays and use this data to create a line plot. Fourth graders can use their line plots to explore finding the median.
Planning a holiday party? Survey the students on what should be served and what activities should be included. Students can present the findings in a graph and use the results to determine how much and what needs to be donated or purchased to make the party a success.
The holidays are a great time to share family traditions. Why not use that information to meet some graphing and data analysis standards?
For other ideas to keep students engaged in learning read Mental Math Breaks from December 2017.


 • Instagram photos and videos")
 • Instagram photos and videos")
 • Instagram photos and videos")
 • Instagram photos and videos")
 • Instagram photos and videos")
 • Instagram photos and videos")


